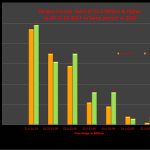
Sales of single family homes from $1.5 Million and higher totaled 155 homes vs 136 for the same period last year. This represents an increase of 14% over last year. The table below shows the breakdown by price categories ( all data collected from the NJ MLS and is deemed reliable but not guaranteed)
<< Click The Photo to enlarge the graph.
It seems that a lot of money that was so far parked in the banks has been released to take advantage of the historic low prices and interest rates. While the sales of the $1.5 Million and up are higher than last year, the sales of up to $1Million are 3% lower ( in units) than the same period in 2010.
|
Range in Millions |
2010 |
2011 |
% |
|
|
|
|
|
|
|
|
$1.5-$1.74 |
47 |
49 |
+4% |
|
|
$1.75-$1.99 |
35 |
31 |
-11% |
|
|
$2.0-$2.49 |
29 |
35 |
+21% |
|
|
$2.5-$2.99 |
11 |
16 |
+45% |
|
|
$3.0-$3.99 |
9 |
16 |
+78% |
|
|
$4.0-$4.99 |
4 |
3 |
-25% |
|
|
$5.0-$9.99 |
1 |
4 |
+300% |
|
|
$10.0+ |
0 |
1 |
|
|
|
|
|
|
|
|
|
Total |
136 |
155 |
+14% |


 English
 Chinese
 Korean
 Hebrew
 Russian